

FiberMap · Fiber network management
Every fiber. Every splice. One live map.
- Device types
- 11, from BTS and OLT to splitter and customer
- Map views
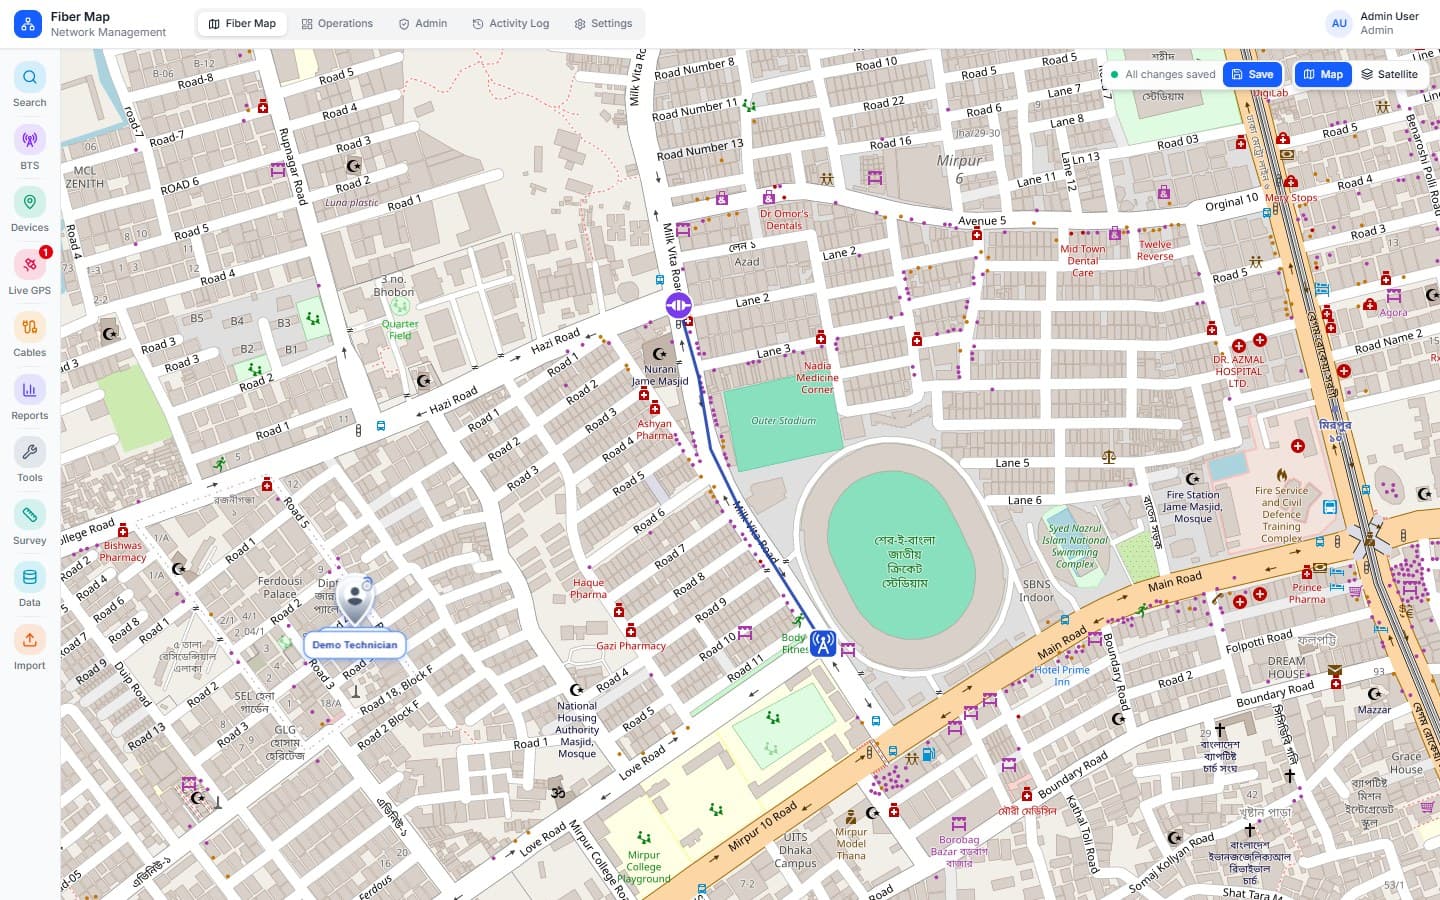
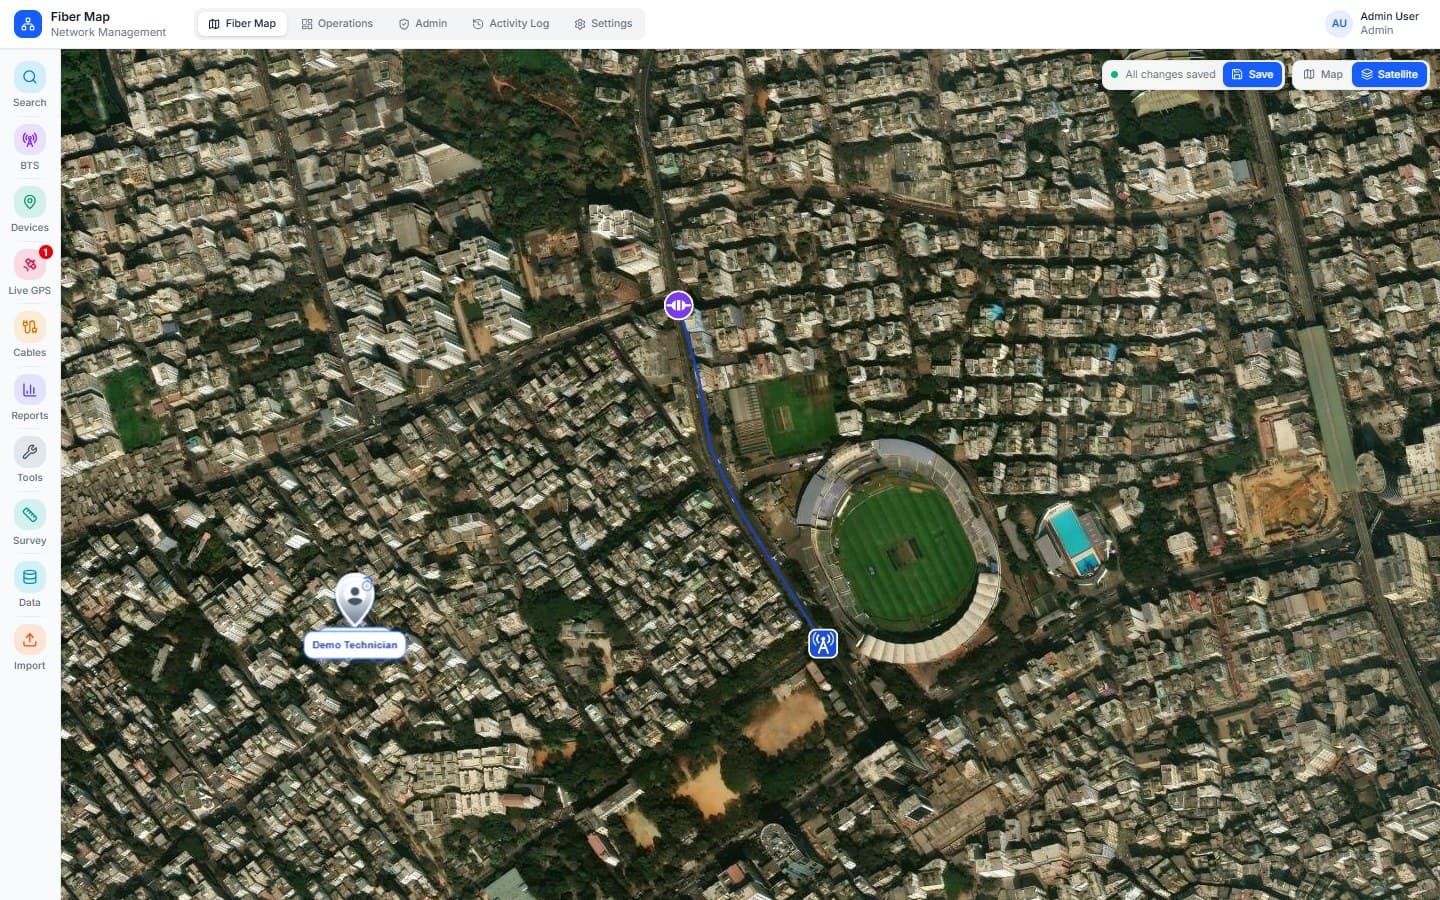
- Street, satellite
- Roles
- 6 built in, per-action permissions
- Live tracking
- GPS positions over WebSocket
- Exports
- CSV, Excel
- Deployment
- Hosted or on-premise
The problem
Your network is too valuable to live in a spreadsheet
Most operators know their network through drawings that are out of date the day after they are made. FiberMap makes the map the single source of truth.
Without FiberMap
- Network drawn in AutoCAD files and spreadsheets that drift apart
- Fault location by phone calls and memory
- No idea which core is free until someone opens the closure
- Field team location known only when they call in
With FiberMap
- One live map every team edits and trusts
- Trace any customer back to the BTS in seconds
- Every core, port and splice documented and searchable
- Engineers visible on the map while they work
Fiber trace
Trace any customer back to the BTS
Pick a customer and watch the light path: every closure, splitter, core and metre of cable along the way.
Fiber trace
Rupnagar Residence
C-2041
- 1,216 m
- Total length
- 3
- Cable segments
- 2
- Splice points
Sample network for illustration. Select any customer to trace it.
From BTS to customer
Every hop of the network, modelled
Tap a point on the route to see what FiberMap records there.
Product tour
See the real application
These are screens from the running product, not mock-ups. Pick a module to open it.
Every BTS, joint closure and cable route on a street-level map, with tools for search, devices, cables, survey and import.
Built for every team
One platform, four ways of working
Planners, field engineers, managers and administrators each get the view they need.
Capabilities
Everything you need to run a fiber network
From the first BTS to the last customer drop.
Network mapping
Place BTS, OLT, ODF, switches, routers, TJ boxes, joint closures, handholes and customers directly on the map.
Cable & splice management
Draw cable routes with core counts and measured lengths, then document every splice in the splice panel.
Live GPS workforce tracking
See where field staff are right now, filter by zone, and review the route each person travelled.
Operations control center
Attendance, ticket flow, SLA compliance and field movement for every zone and support office.
Customer survey
Survey a customer location, find the best connection path to the nearest network point and prepare a report.
Roles & permissions
Admin, zonal head, engineer, technician, surveyor and viewer roles, each with fine-grained permissions.
Activity log
Know who created, changed or deleted what on the network, and when. Filter and export to CSV.
Reports & import
Device and cable totals exported to CSV or Excel, plus bulk import for existing network data and users.
Plan & document
- Street and satellite map views
- Device placement
- Cable routing
- Splice panel
- Rack and ODF view
- Fiber trace
Operate
- Live GPS tracking
- Attendance
- Ticket analytics
- SLA compliance
- Customer survey
- Daily distance stats
Administer
- User management
- Bulk user import
- Roles and permissions
- Zones and support offices
- Activity log
- CSV and Excel export
Access control
The right access for every role
Six roles come built in. Pick one to see what it can do.
Admin
Full system access
7 / 7 actions
Example configuration. Administrators can switch each permission on or off for every role.
Platform
Engineered for networks that never switch off
A spatial database underneath, real-time updates on top, and an interface that works as well on a phone in the field as on a wall screen in the NOC.
Hosted by us
We run FiberMap for you, with backups, monitoring and updates included.
On your servers
Deploy inside your own data centre when network data must stay in-house.
Secure by design
Signed sessions that expire, role-based access and a full audit trail.
$ fibermap status
● all services operational
Rollout
Live on FiberMap in about four weeks
A typical rollout for an operator with existing network records.
- 1
Week 1
Import
We load your BTS sites, devices and cable routes from existing CSV files and drawings.
- 2
Week 2
Configure
Zones, support offices, roles and permissions are set up to match how your teams work.
- 3
Week 3
Train
Planners, field engineers and managers each get a hands-on session on their own screens.
- 4
Week 4
Go live
Your network runs on FiberMap, with our engineers on call through the first month.
Bring your data. CSV import for network data and bulk import for users are built in.
Start with one zone. Pilot in a single area, then extend zone by zone.
“We finally have one map our planners and field engineers both trust. Locating a fault used to take half a day of phone calls. Now the trace is on screen before the team leaves the office.”

Rahim Chowdhury
Head of Network Operations, Skyreach Broadband
FAQ
Questions operators ask us
See your own network on FiberMap
Send us a sample of your data and the Uddam IT team will show it to you on the map in a live session.